Everything that’s complicated to do in Google Analytics than Plausible
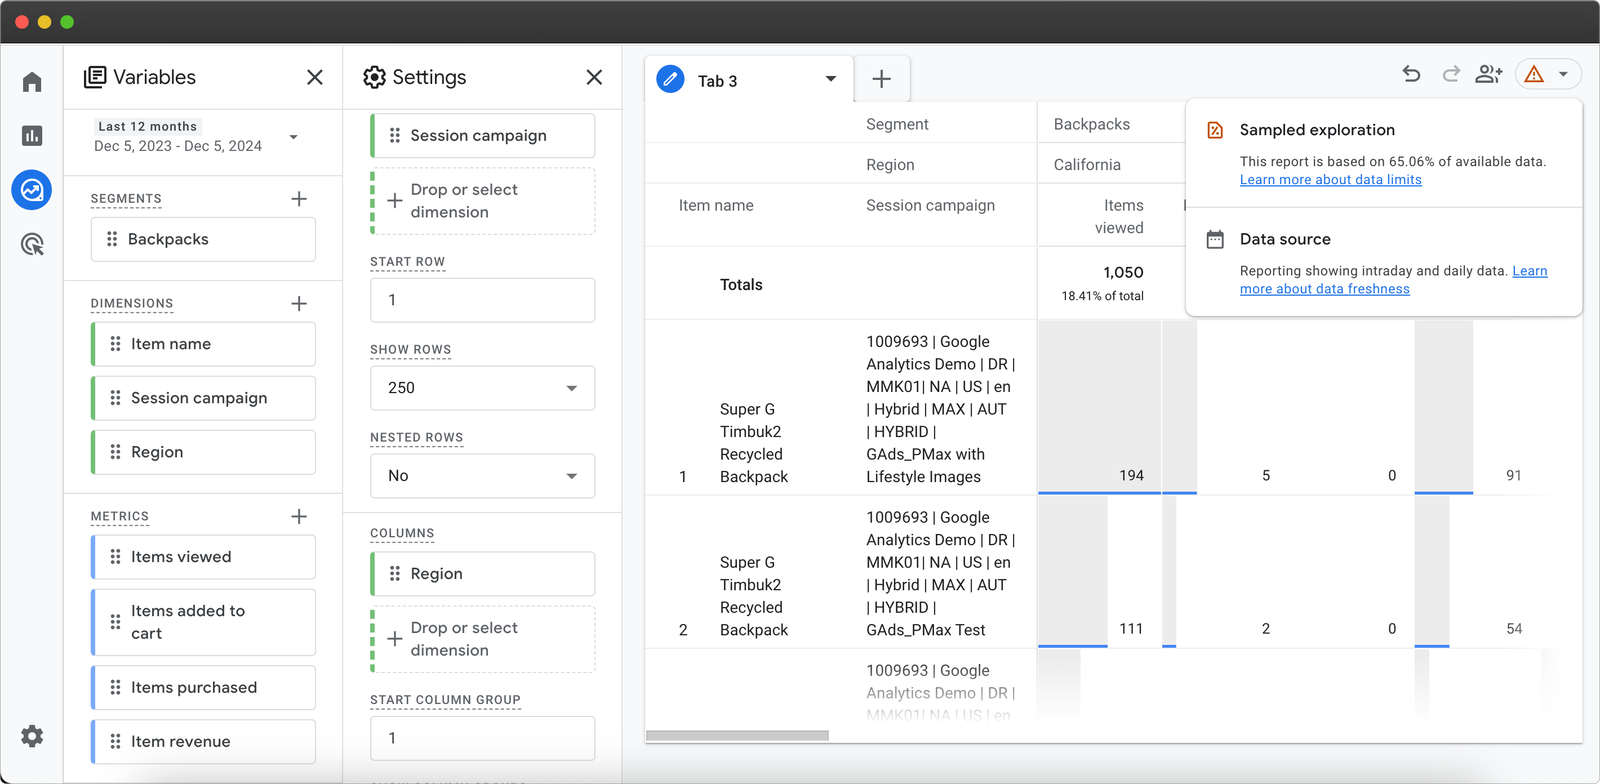
The Google Analytics 4 interface has multiple reports, beneath multiple layers of menus. Some reports are standard, i.e. pre-made and available by default, while others are custom (“Explorations”) that you need to create on your own from scratch.
Amongst these maze of reports, insights are hidden. Site owners, especially businesses, need a bunch of insights and have some questions about their website’s performance that should be fairly straightforward to get.
But fetching most of such insights from GA4 requires going through multiple different standard reports while editing them, using Explorations to build custom tables from scratch, or using a combination of both depending upon the use case––all this while still dealing with inaccurate numbers.
And it is not usually as simple as going through a how-to guide and creating and accessing the right reports, but usually needs users to go through full GA4 and GTM (Google Tag Manager) courses, learning the right terminologies, how they are interconnected, setting the right things up, debugging, etc.
We created Plausible with simplicity in mind, so you wouldn’t have to worry about any of that. You get a one-page report with all the important insights (not less). Which are those and how are they found in Google Analytics 4 vs Plausible?
Helpful tip: You can open our live dashboard in another tab now as we keep referencing it throughout. You can also open the official GA4 Merch Shop demo property in a third tab to make the comparisons easier.
- Quick revision: Standard vs Custom reports in Google Analytics 4
- Finding insights in GA4 vs Plausible
- Other reasons Plausible is a superior web analytics choice
Quick revision: Standard vs Custom reports in Google Analytics 4
Google Analytics is mainly divided into two types of reports: standard reports and custom reports, aka Explorations. All the pre-built reports that are available under the “Reports” sidebar in GA4 are the standard ones.
If you go to “Explore” from the sidebar, you can create custom reports (known as Explorations) with the data that has been collected for your site and visualize them in different forms like table, funnel, tree graph, venn diagram, etc.
Finding insights in GA4 vs Plausible
How many people visit my site and how well they engage?
In Plausible
In the Plausible dashboard, the metrics that a site owner immediately wants to know are in the top bar: unique visitors, total visits, total pageviews, views per visit, bounce rate, and visit duration along with improvements/declines in those numbers for the selected time period.
Needless to say, it’s a complicated bunch of things to do in Explorations. And it could provide good advanced use cases for very large teams or agencies. But the problem is that some insights are fairly standard and essential to know for site owners but you still need to make use of Explorations –– complicating simple processes.
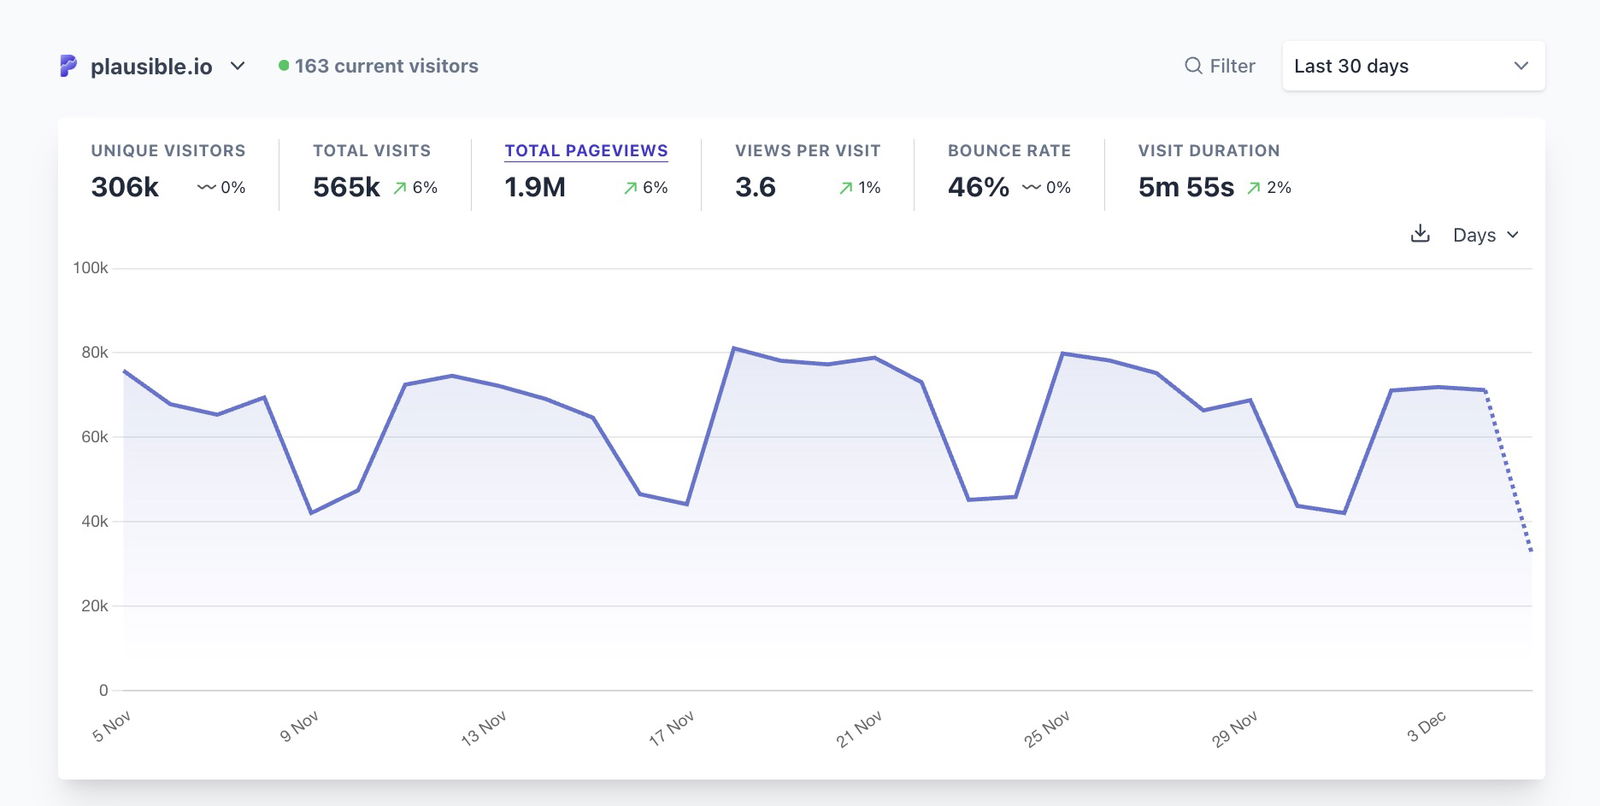
In case you want to confirm what these metrics mean, you can have a look at the definitions.
In GA4
These metrics are found in different reports under different groups on the sidebar. It depends on what groups you see based on business objectives you select while signing up on GA4. But the individual standard reports are named the same.
The aforementioned metrics are also available as metrics in GA 4 which can essentially be added to any standard or custom report using the edit report feature. FYI: Metrics are numerical parameters that measure the performance of something.
But if you want to know where these insights are typically housed (based on the GA4 structure) when you open your GA dashboard, you will need to open different reports as explained below.
Unique visitors: Are known as “users” in GA4 and this metric is available in the User Acquisition report.
Quick context: Why “user acquisition”? This is because GA4 profiles users and tries to separate unique users from total sessions, with the help of cookies. Plausible, though, is privacy-friendly and only counts aggregated stats in terms of sessions and never tracks individual users.
Total visits: Are known as “sessions” in GA4 and this metric is available in the Traffic Acquisition report.
Total pageviews: This metric is available in the Pages and Screens report.
Views per visit: This metric is also available in the Pages and Screens report but not by default. It needs to be manually added using the report edit button.
Bounce Rate: Bounce rate is also available as a metric which needs to be manually added to any of the reports you are viewing. It is not available by default and there’s no one-stop place to view it.
Time on Page: “Time on page” was sunset after UA but you can find the Average Engagement Time per User and Average Engagement Time per Session metrics to be added to any report. You may also find these in the Engagement Overview report. But we found them to be underreporting by as much as 80% as compared to Plausible’s Time on page.
P.S. While editing any standard report to add such metrics, don’t forget to “Save” them. It will avoid the trouble of adding the metric again and again.
The pages from where people leave my site?
Exit reports show where users leave your site. This can help you spot problems, like ineffective content or confusing pages. Although not all exits are bad—like when someone leaves after finishing a purchase. And that is exactly the insight we need.
In Plausible
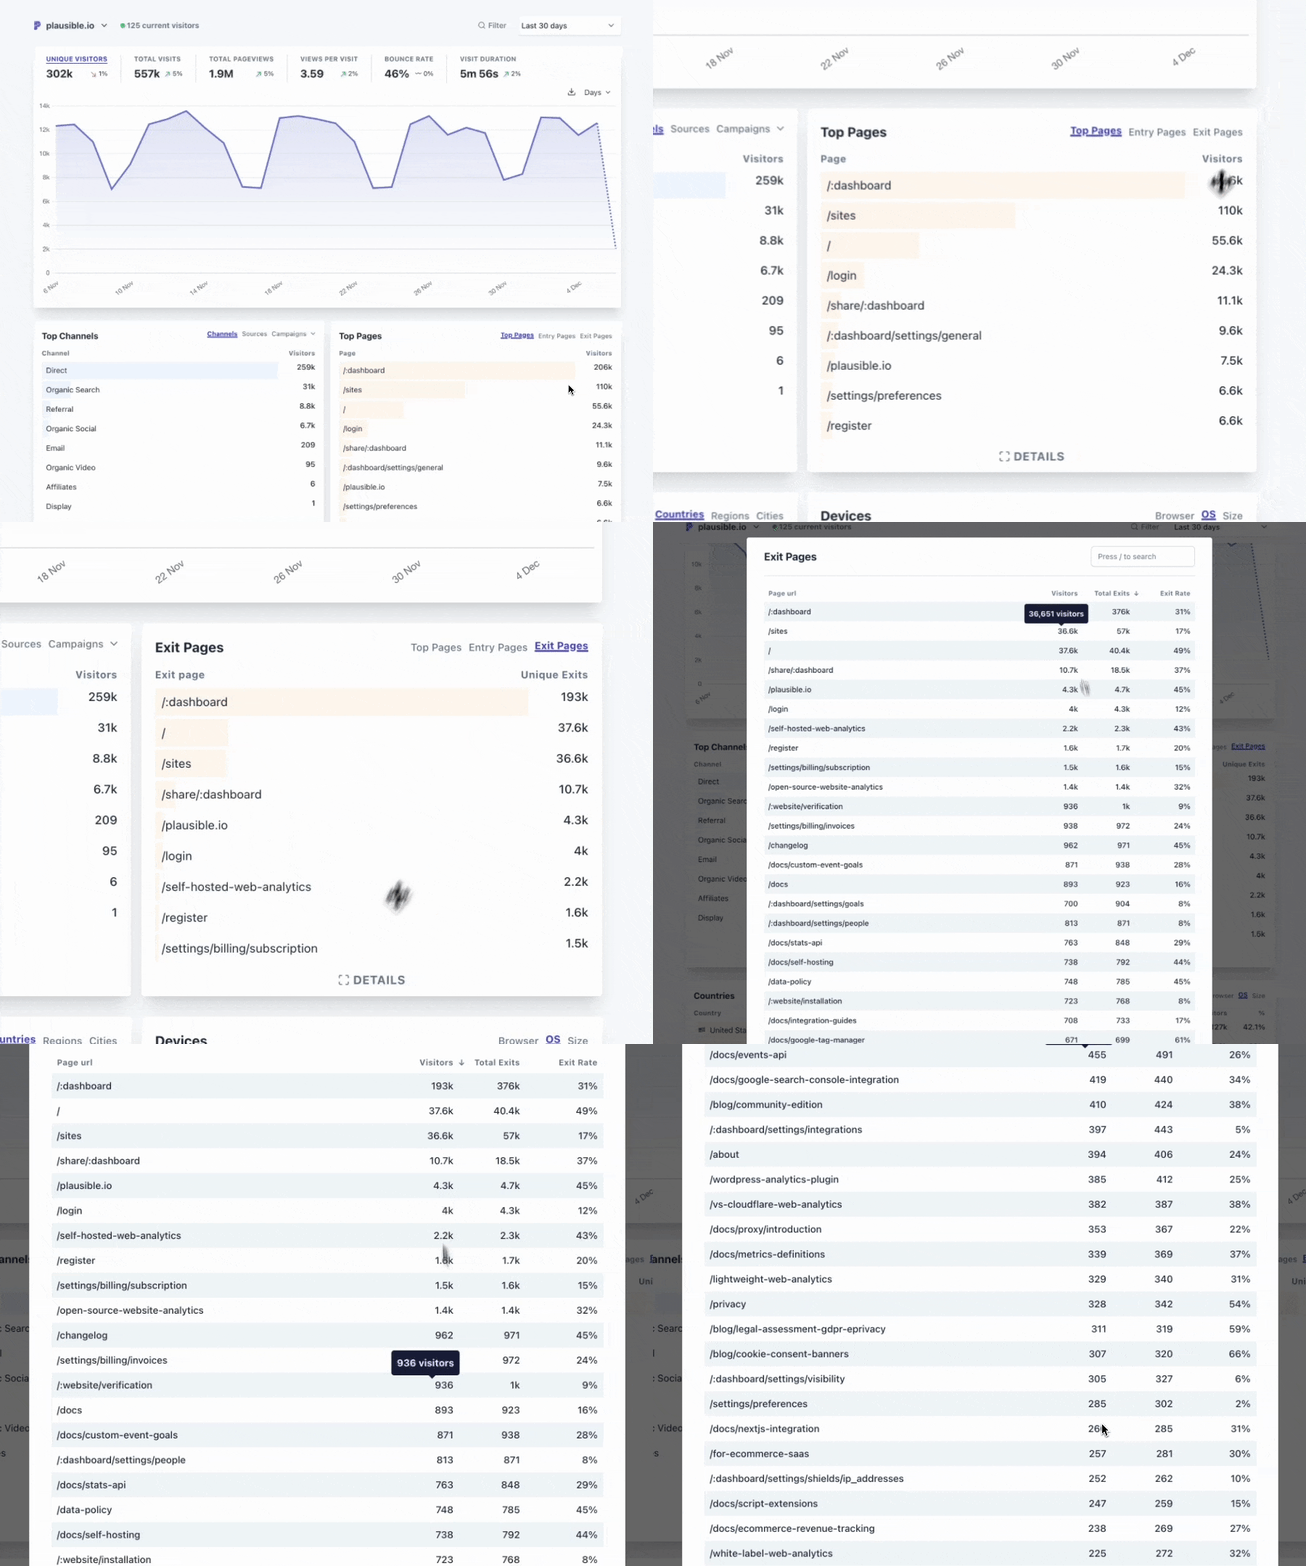
You will find a straightforward, easily accessible “Exit Pages” report with metrics like:
- Visitors: Unique visitors exiting the site from that page
- Total exits: The number of exits made from that page
- Exit rate: The number of exits divided by the number of total pageviews for that specific page.
In GA4
In Google Analytics 4, an Exit pages report is not available. Your GA script does collect the “Exits” metric but it is not available in standard reports but only in Explorations.
Here are the steps recommended from GA4 experts:
- Go to Explore in GA4’s left sidebar.
- Create a new Blank or Free form report.
- Add the Page path and screen name dimension (or alternatives like Page Path + query string).
- Import the Exits metric by clicking the Plus icon in the Metrics section.
- Add dimensions and metrics to the exploration by double-clicking.
- Sort by Exits to identify the top exit pages.
Also, if you use the Looker Studio, then the Exits metric is not available therein.
How many conversions were acquired from which source, page, city, device, etc.?
Conversions are known as Goals in Plausible and Key Events in Google Analytics 4.
In Plausible
You can scroll down to the “Goal Conversions” section of your dashboard. Here you will find the list of goals converted for the selected period, along with their Click Rate, Visits and Revenue too if you’ve enabled revenue tracking.
Clicking on any of these goals will filter your dashboard. This makes finding the essential associated information for each event/goal extremely straightforward. You can also include additional filters like Country, Channels, Pages, etc., to get more granular information.
Learn more about conversions and revenue attribution here
![]()
In GA4
GA4 lets you collect various events and mark some as key events. Note that that in itself is a cumbersome process.
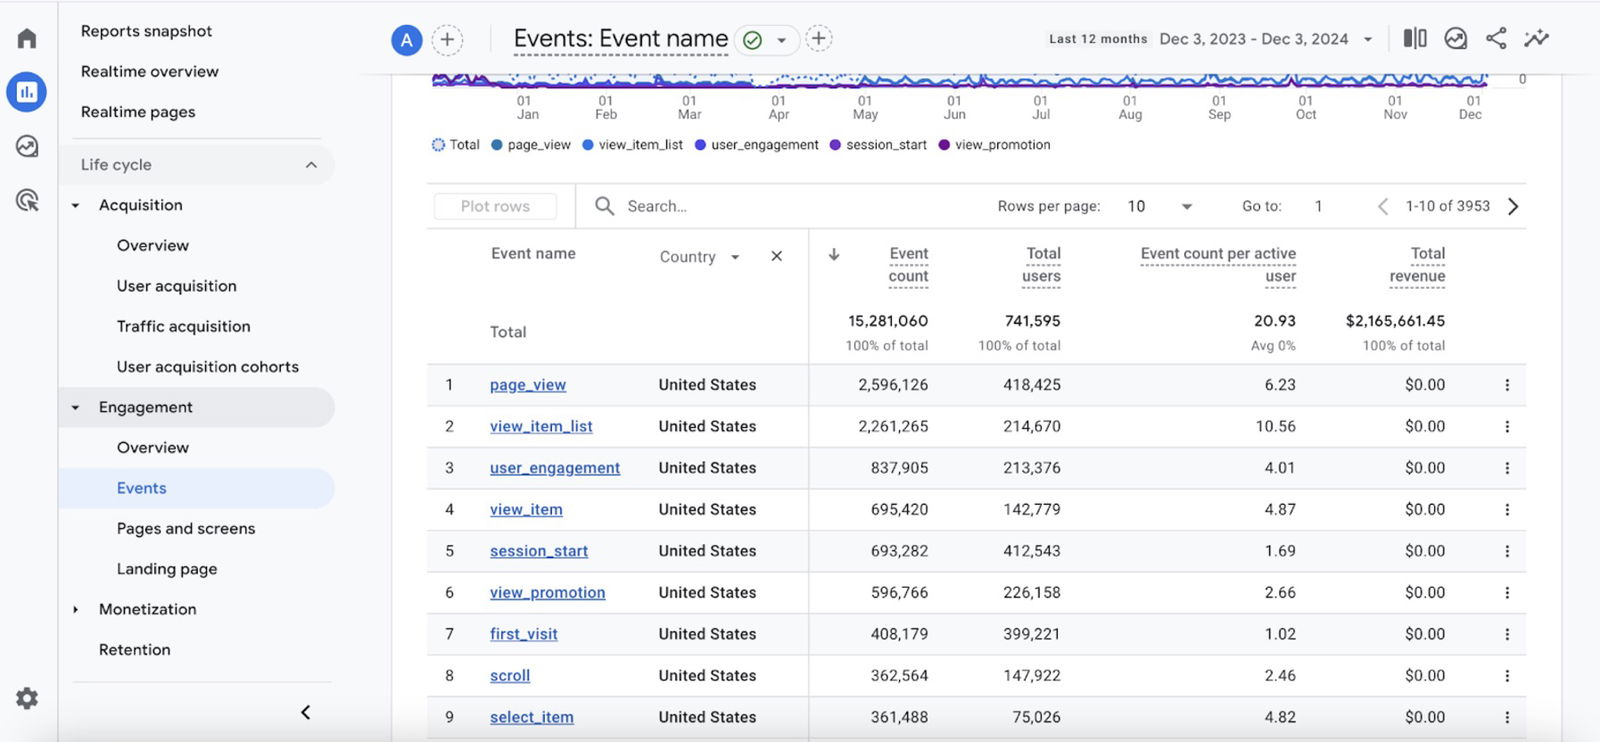
You get a standard Events report, which includes both events and key events. Here, you can add secondary dimensions, like Country, Device, etc. Key events data is also available in the Traffic and User acquisition reports, and Monetization reports if enabled.
The problem is that you can’t view all the info in one go, like available in Plausible. To get a report like that, you will again need to go to Explorations and build it all from scratch. How to do that would depend on the dimensions and metrics you want to view for the associated key events.
Segmentation of audiences
In Plausible
In Plausible, your audience data is already presented in useful reports like channels of acquisition, pages they visit, the locations they come from, and the devices they use. Clicking on any entry (or entries) filters the dashboard to show only the data pertaining to those filters –– creating segments.
For eg. If we want to study Plausible site’s UK visitors who upgraded to a paid subscription, in the year so far, we can simply use the following filters and make ourselves a segment. This hardly takes a few seconds and no learning curve.
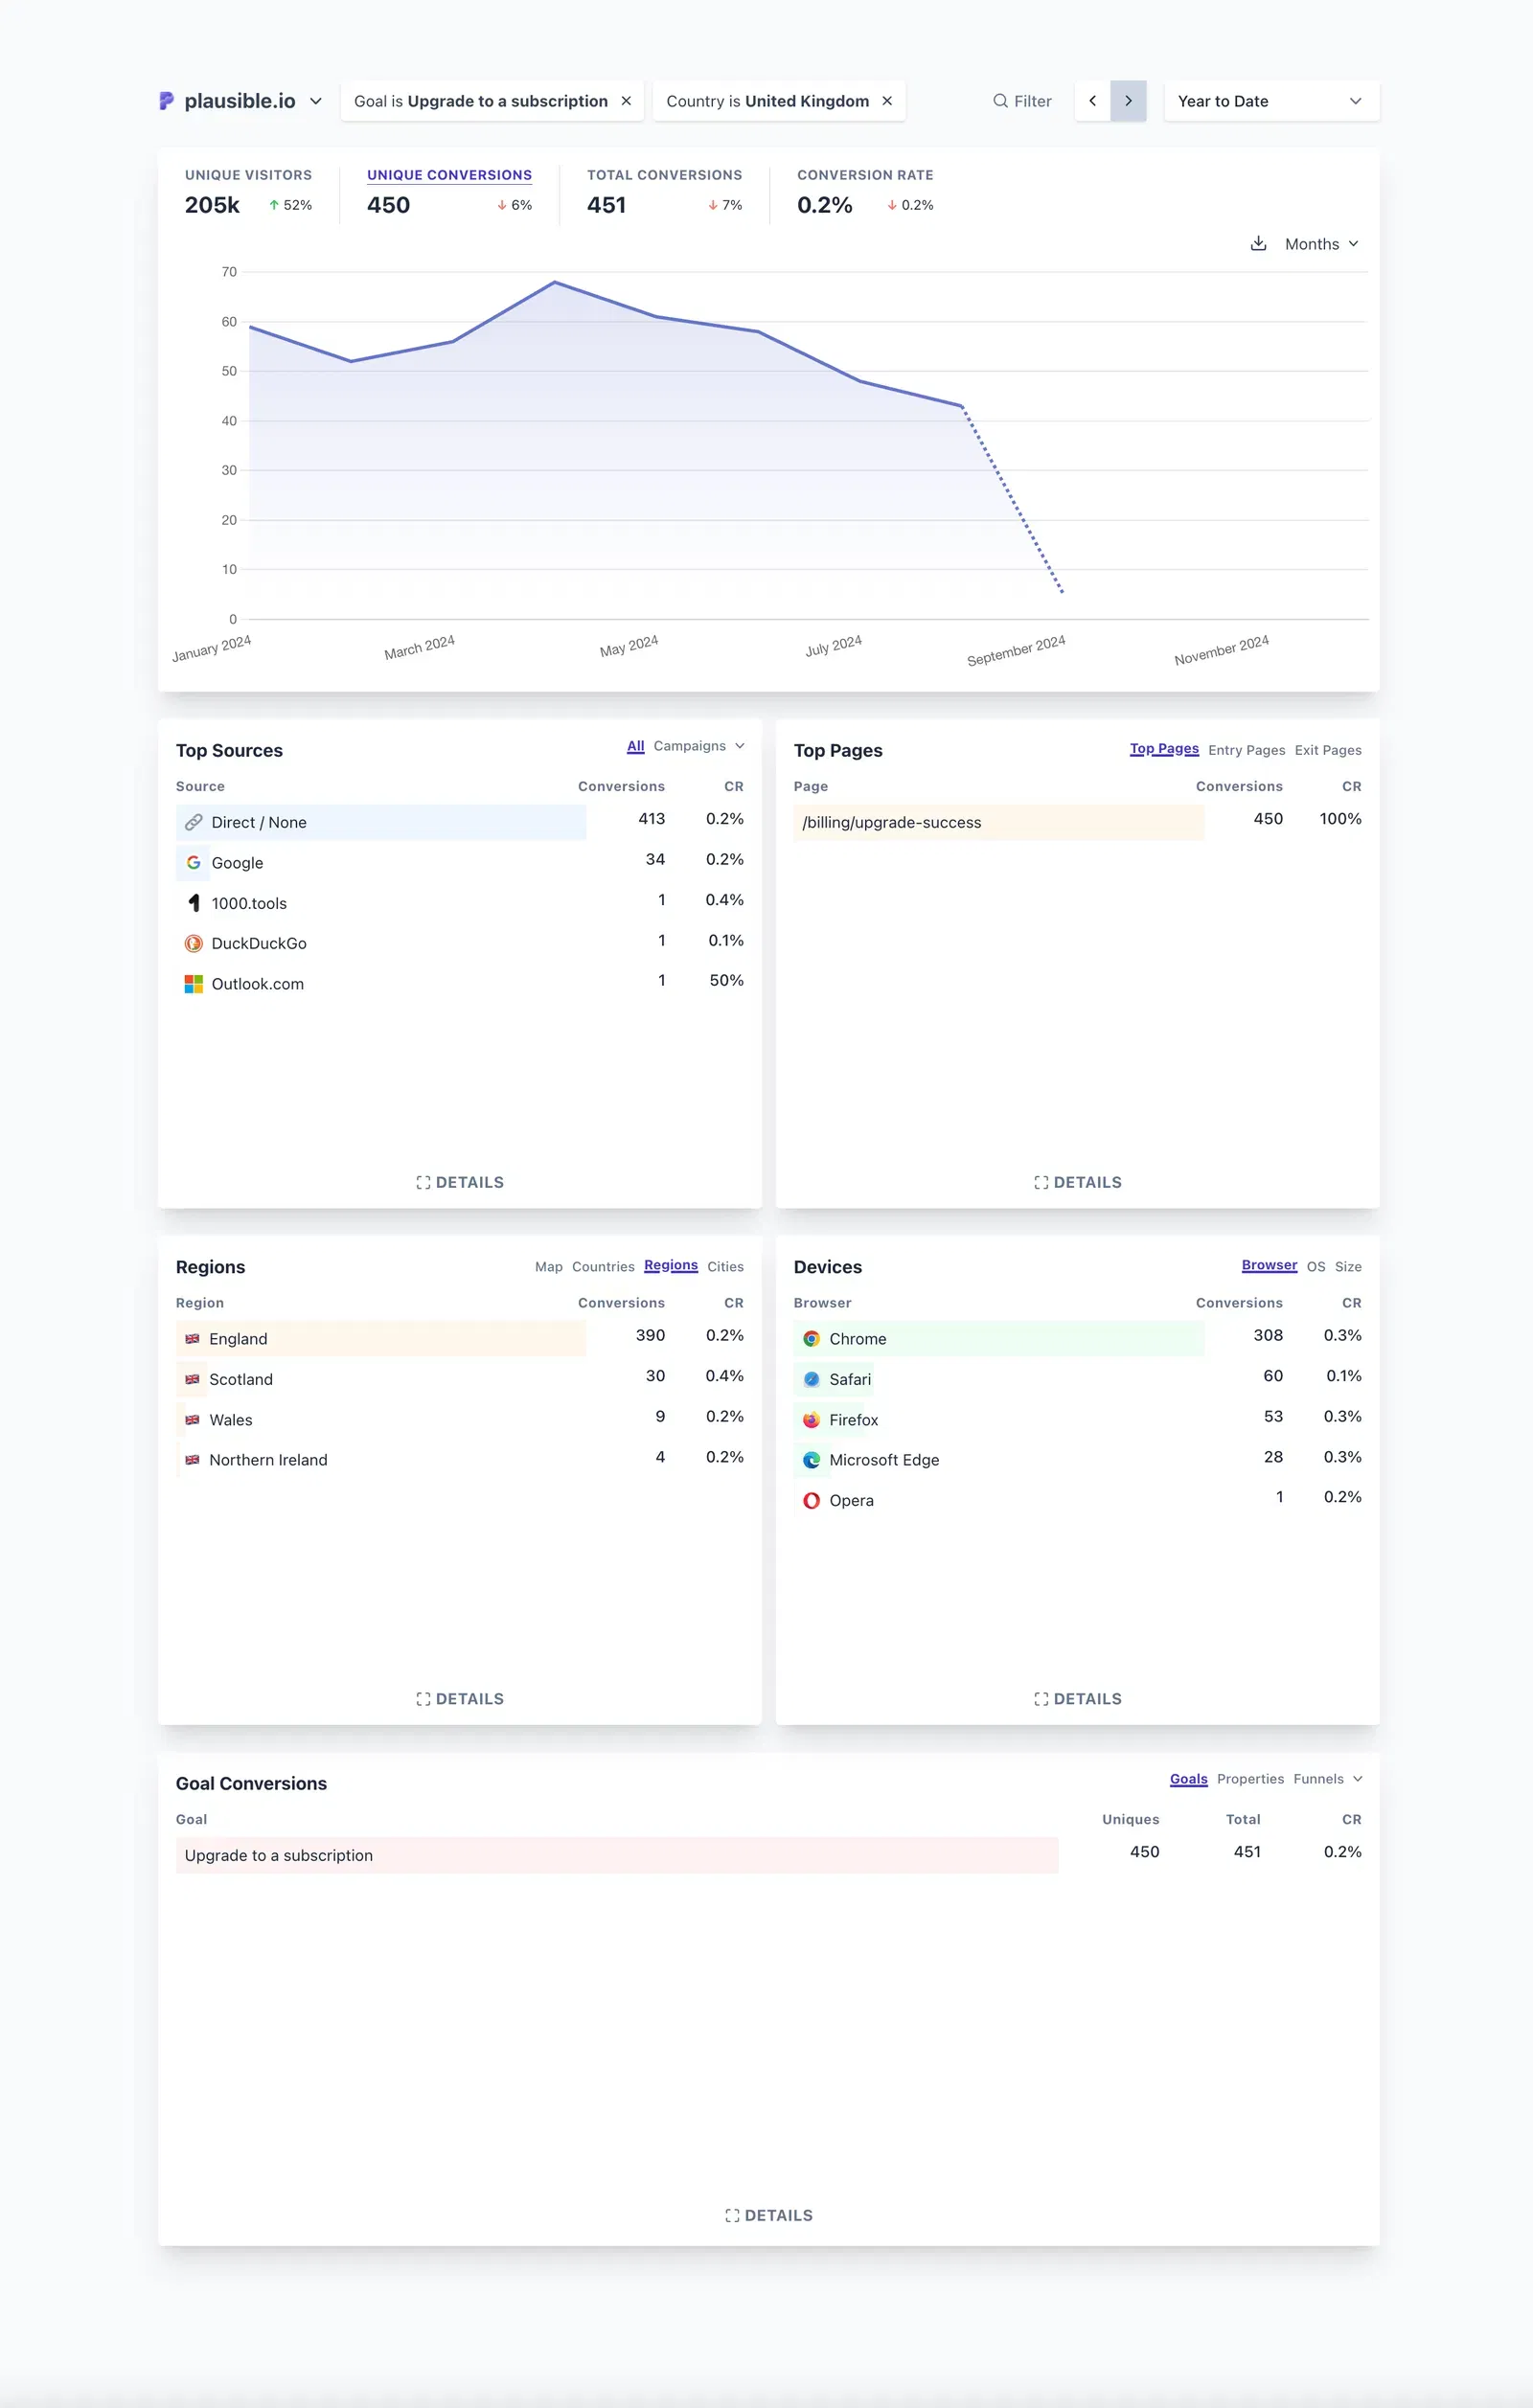
You can see more about what audience segmentation is and how to do it in Plausible.
In GA4
Segments can only be studied in Exploration reports. First you need to create a custom segment by going to Admin -> Data Display -> Segments. Or, you could do the same while adding a segment in an Exploration.
Also, Audiences cannot be directly used in explorations. However, you can create audiences using segments derived from explorations.
Similarly, comparisons are not directly usable in explorations. However, by clicking the Explore button in the comparison’s sidebar navigation, those comparisons will be converted into segments for use in that specific exploration.
Here’s how to study a segment in GA4:
- Go to Explore in the Google Analytics 4 menu.
- Click + Create New Exploration and select Blank.
- In the left panel, click + New Segment under “Segments.”
- Choose User Segment, set your conditions, and save.
- Drag the segment into the Segment Comparison area.
- Add relevant dimensions (e.g., Age, Country) and metrics (e.g., Sessions) to the workspace.
What’s happening on the website in real-time?
In Plausible
Simply select “Realtime” from the time period filter or press R on your keyboard. You can even select any other entry (like an acquisition channel, a page, a goal, etc.) to filter real time traffic further and make important decisions in real time.
This is especially useful in making real-time decisions, for instance on high volume, high spend media buying campaigns. Check out our real time dashboard here.
P.S. We also always display the number of current visitors on your site at the top even when a different time filter is selected.
In GA4
This is a hugely misleading report in GA4 as per several complaints.
The real time data is available as two different reports: “Realtime overview” and “Realtime pages.” The Realtime overview can be quite confusing with multiple cards and different terminologies as you can see below:
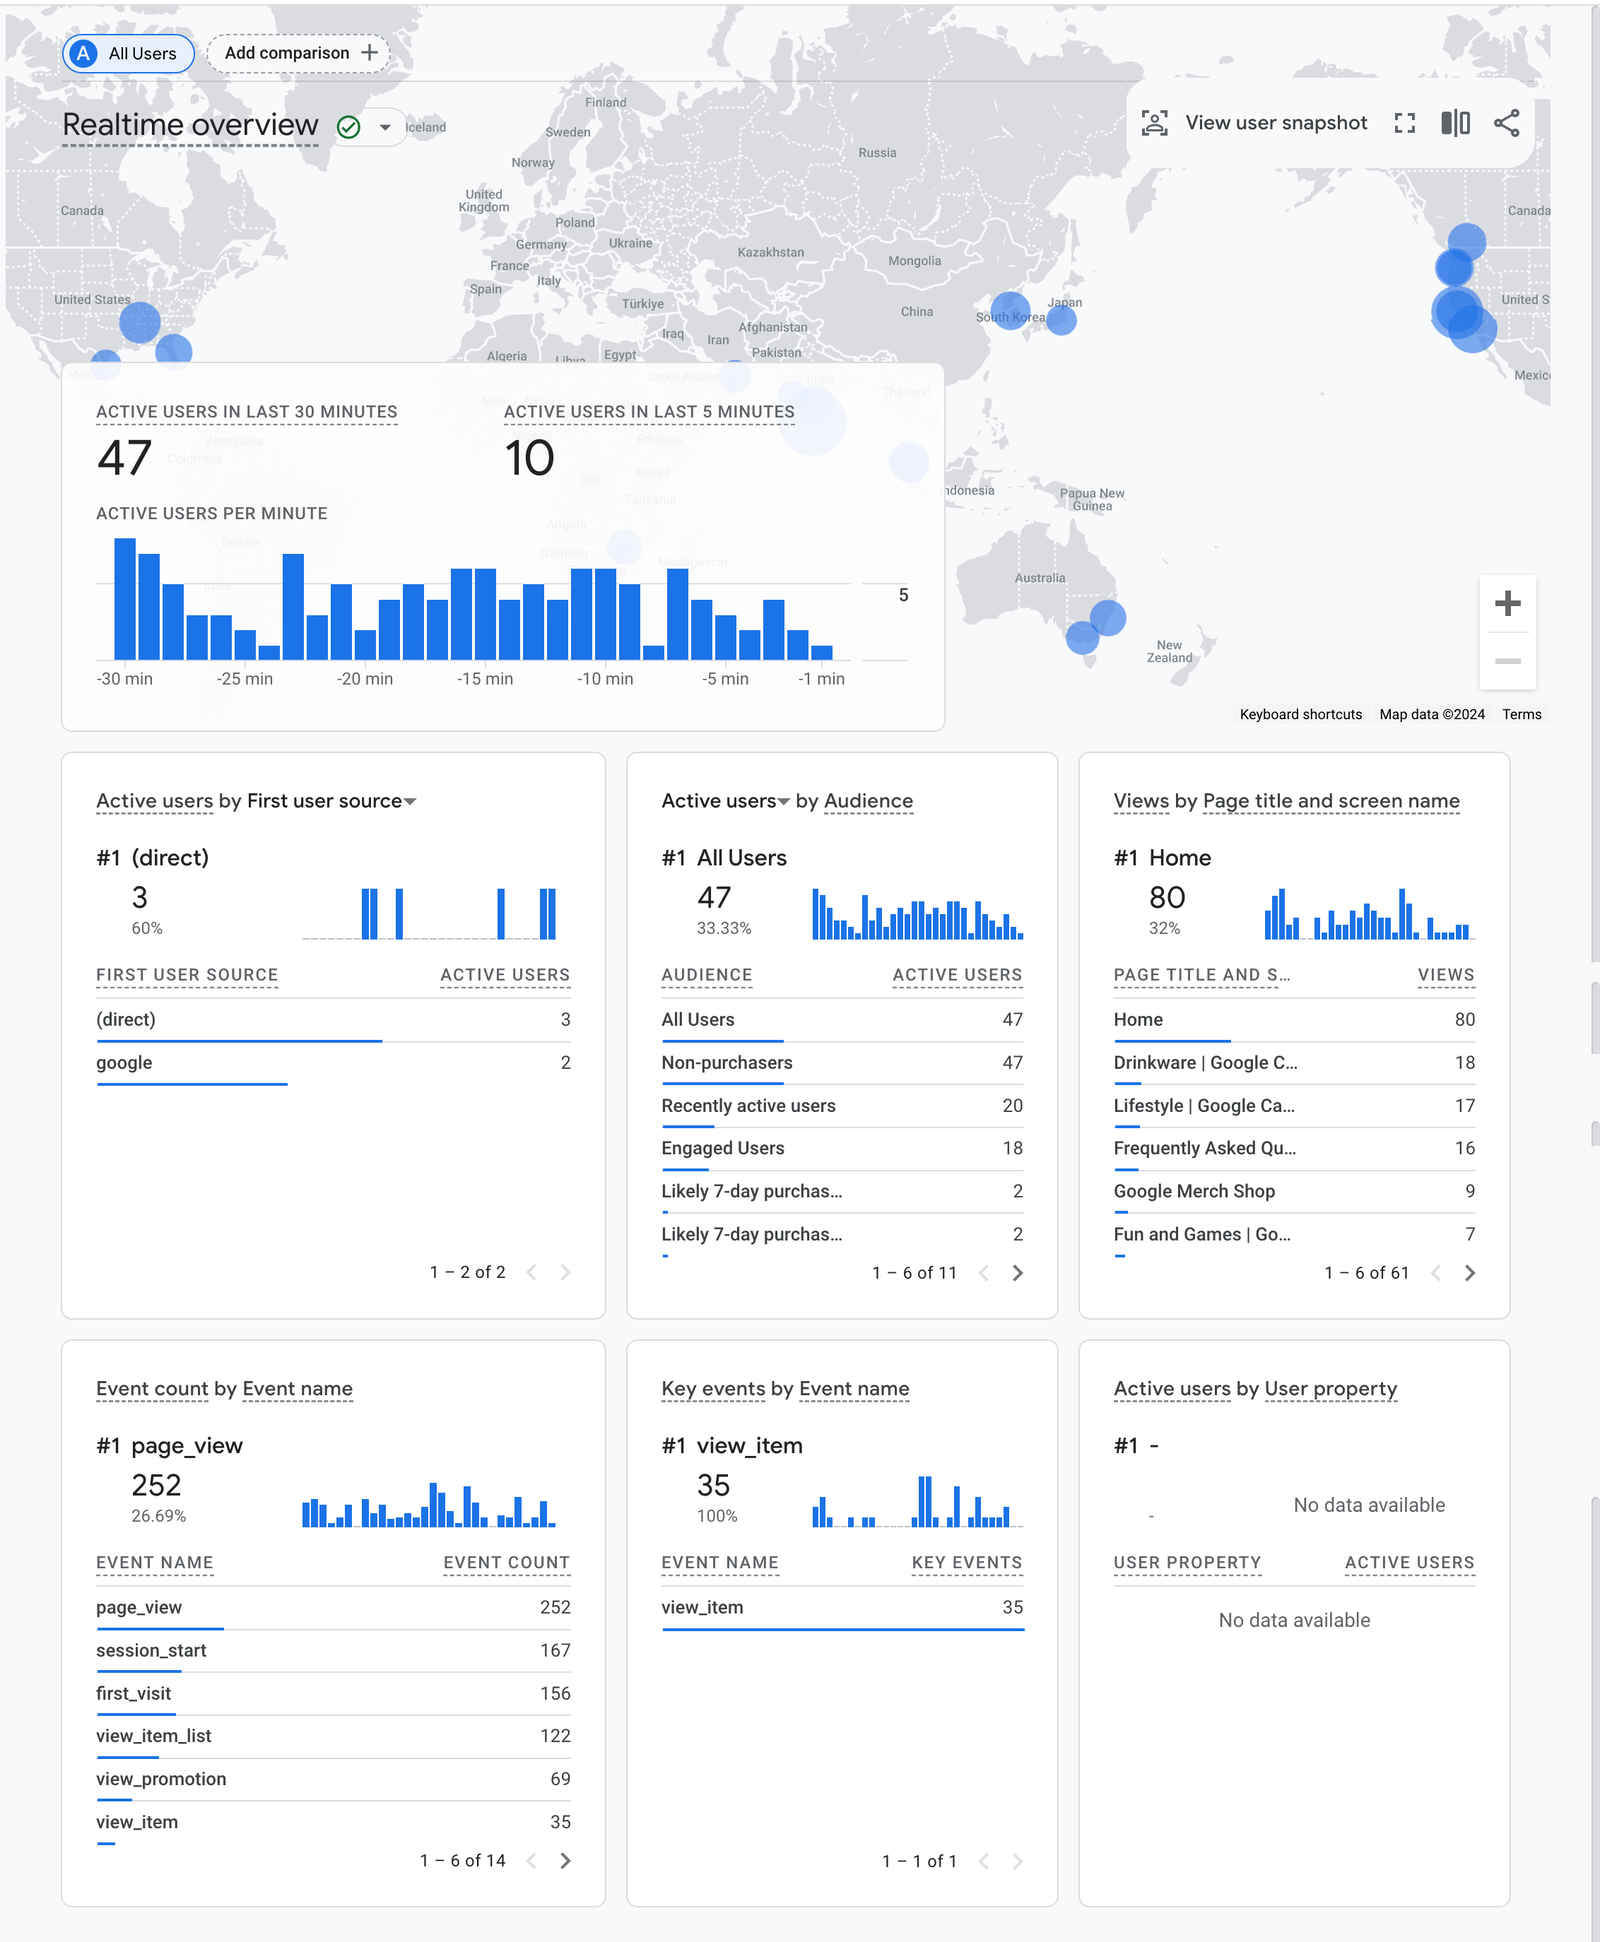
But it wouldn’t matter because the data you see here is most likely wrong. Google Analytics takes upto 48 hours to process data and that probably is the reason for this discrepancy.
Other things
There are other things easier to do in Plausible than GA4 that are worth mentioning below. Such insights have their own standard reports in the GA4 interface but can still be complicated.
Traffic acquisition report
It’s easy to see your traffic acquisition channels, sources, referrals, and exact UTM-tracked parameters in one place in Plausible. As usual, selecting any entry will further segment your dashboard too.
And you can see how many visits vs uniques you got from each channel, source, campaign, etc.
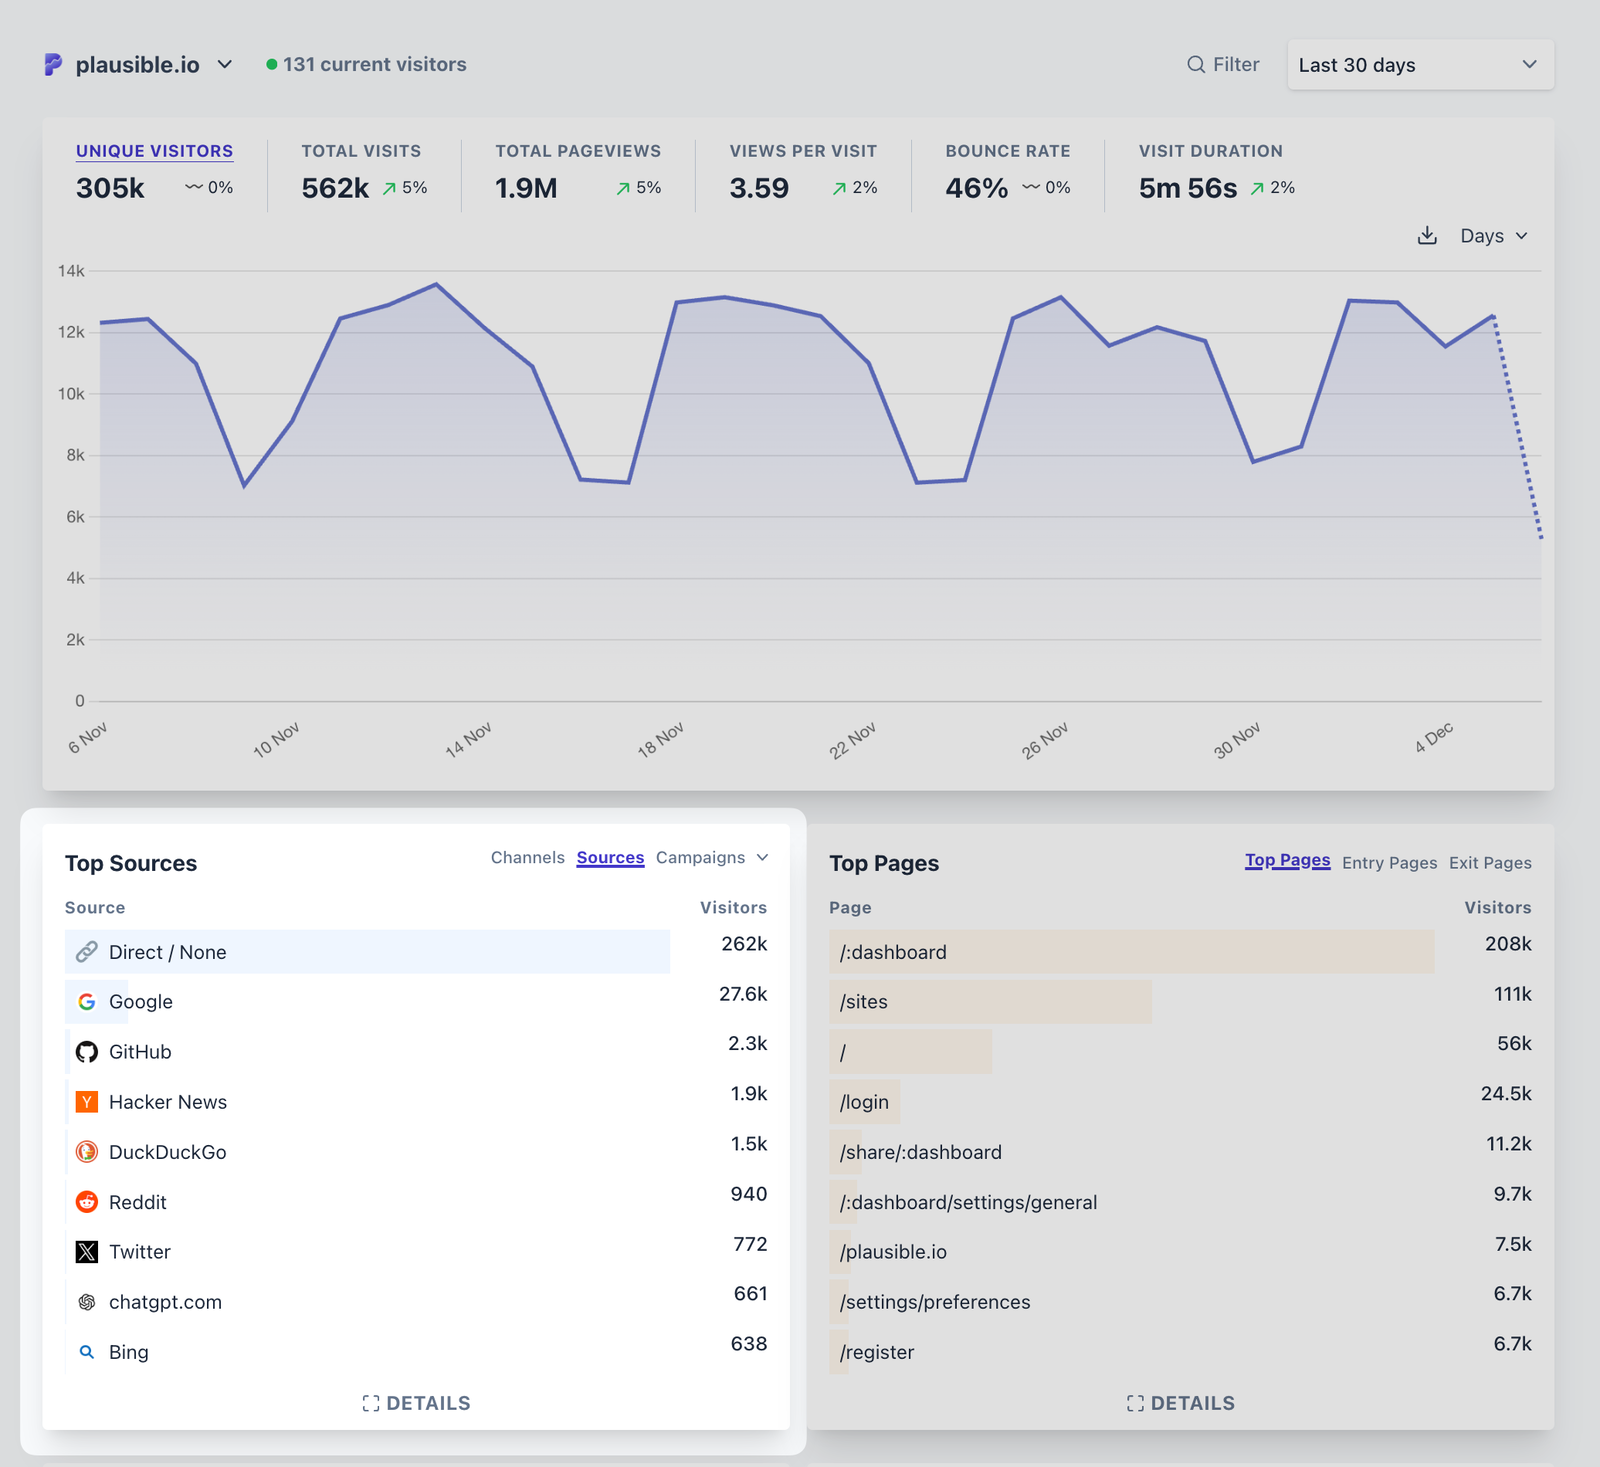
We also do a bunch of other stuff that GA4 does not, like consolidating duplicate entries stemming from case-sensitivity, correctly grouping traffic from AI referrals, etc. There’s a good overview provided here.
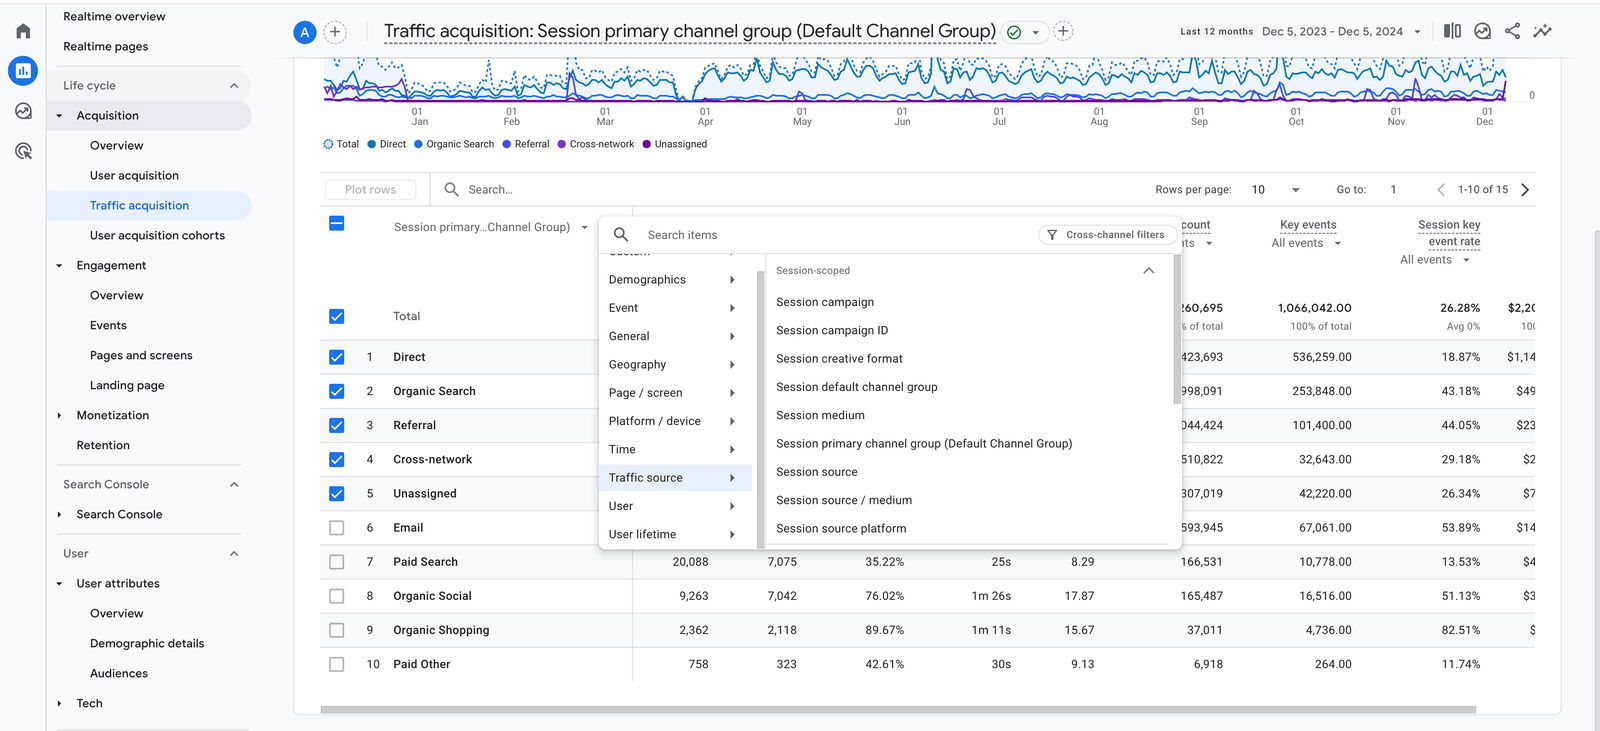
In GA4, you get a separate Traffic acquisition and User acquisition report. Traffic acquisition tracks the sources from where traffic is acquired. User acquisition tracks the sources from where individual users are acquired.
In this report, you get a breakdown of traffic, key events, etc., by channels by default. But needing more info like UTM source/medium, needs you to add a secondary dimension. Something like this:
Demographic and tech reports
In Plausible, these are again straightforward to get as is visible in our live demo.
In GA4, country, region and city need to be selected as a primary and/or secondary dimension in Demographic reports –– one at a time. Plus city info is not accurate in GA4 due to IP anonymization measures.
Same thing needs to be done for getting the Browser, OS, device info, etc., in yet another “Tech details” report. Phew.
Entry Pages report
This is available in Plausible right beside the Top Pages and Exit Pages report.
You do get a landing page report in GA4 which shows the pages where visitors first land on your site. However, “Entrances” as a metric is only available in custom reports, a.k.a. Explorations.
This confuses GA4 users because landing pages and entrances measure the same thing but the only difference between them is that the former is a dimension with its own standard report while the latter is a metric that can be used to create custom reports.
Custom dimensions
In Plausible, you can straight away filter your dashboard by a collected custom property. Custom properties is our simpler version of custom dimensions. See an example of filtering the dashboard just by using a custom property.
In GA4, they need to be added as a secondary dimension to the particular report you are viewing. For more holistic insights, you need to open the Explorations reports.
On top of that, custom dimensions are not easy to set up in GA4. You need to set up some events first (while ensuring they don’t fall under existing categories of events in GA’s documentation), then attach parameters using Google Tag Manager, followed by registering the custom dimensions in GA4 interface.
We explain this process and custom dimensions in more detail
Other reasons Plausible is a superior web analytics choice
- Plausible is privacy-friendly by default. We never use any cookies or persistent identifiers to track visitors outside of your website. This means you are compliant with various regulations around the world by default, be it GDPR, CCPA, PECR, or anything else. You won’t even need to put up a cookie consent banner from our side.
- Our stats are always more accurate as compared to Google Analytics because their tracking script is widely blocked by ad blockers and privacy-friendly browsers. There are various other reasons for such inaccuracies that we discuss here.
- We have an extremely lightweight script at ~1.5 kB, at least 75x smaller than GA’s.
- You can also compare Plausible with Matomo and Cloudflare Analytics.
- We are open-source and completely transparent with our practices. We don’t sell your customers data, are not involved in ad tech, and are an independent team that only cares about a good product.
Transitioning from GA4 to Plausible? We have a guide to help.
Ready to try the simplest web analytics tool? Create your account now!